In November 2023, Texans running back Dare Ogunbowale attempted a field goal in a real NFL game. I wanted to figure out whether or not this was the right move, so I made a win probability calculator for 4th and Goal situations that could be applied to that game and any others.
The Texans Game 🔗
With 14:11 to go in the 4th quarter, the Texans are down 1 to the Buccaneers. They face 4th and goal from the 9 yard line. The Texans kicker is out with an injury, so their options are between trotting out running back Dare Ogunbowale to attempt a 26 yarder, or go for the touchdown. Using Pro Football Reference’s win probability calculator, the probabilities for a Texans win given the different outcomes are as follows:
| Result | Probability |
|---|---|
| Field goal is missed | 45.8% |
| Field goal is made | 61.9% |
| Touchdown is missed | 49.8% |
| Touchdown is made* | 81.6% |
Note that the win probability is slightly higher for missing a touchdown than missing a field goal. This is because when a field goal is missed the ball is turned over to the other team at the spot of where the kick took place, which would give the Buccaneers a few more yards.
It’s an interesting situation. Teams convert on 4th and 9 about 30% of the time. Using the previous win probabilities, we can find out how confident the Texans need to be in Ogunbowale’s ability to knock down a 26 yarder using the following system:
$$ 61.9x + 45.8(1 - x) > 81.5y + 49.8(1 - y) $$
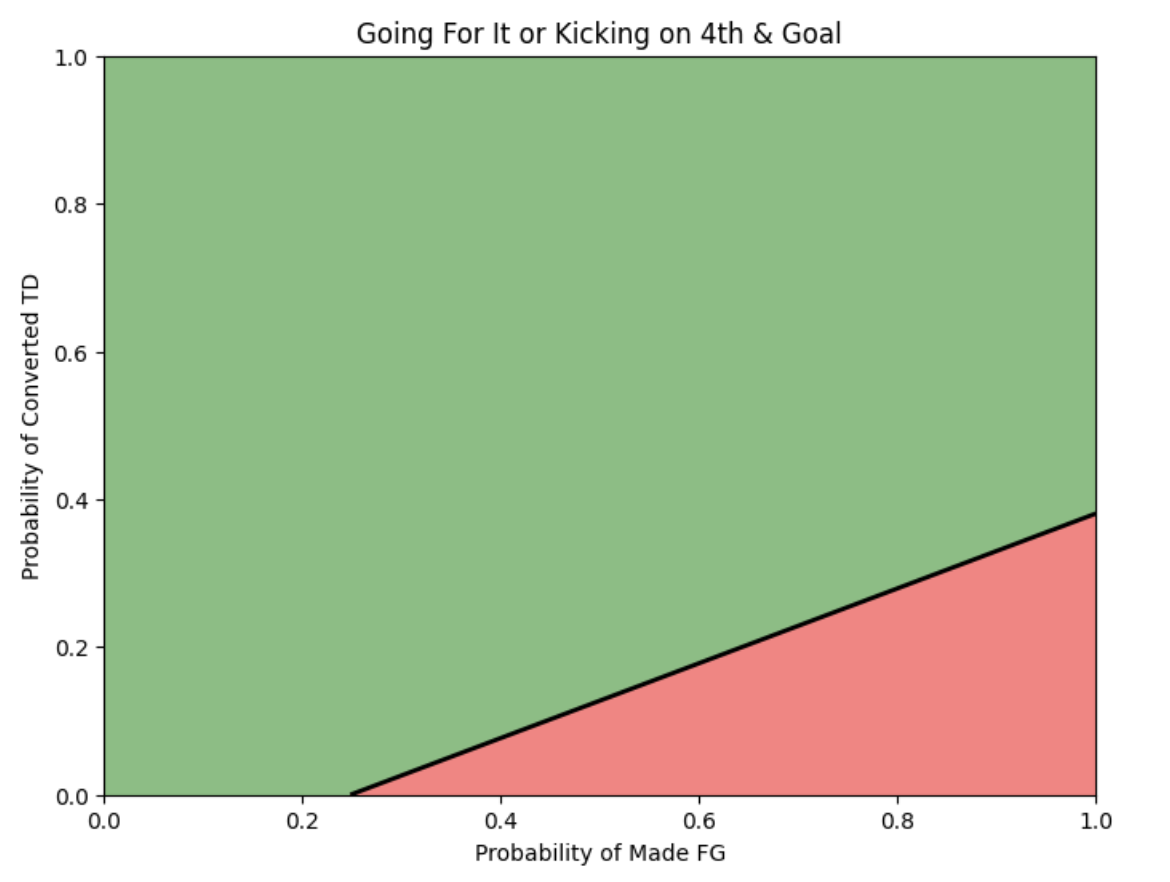
Where x is the probability Ogunbowale hits the field goal and y is the probability they score a touchdown. If that statement is true, the field goal is optimal as the win probability of the attempted-kick-scenario as a whole is higher. Here is a plot of the inequality, where green means “go for it” and red means “kick the ball”.

Looking at the plot, if the Texans really do convert the 9 yard touchdown 30% of the time, it is more effective for them to kick the field goal as long as Ogunbowale converts at 85% or higher from 26 yards out. If the Texans offense is a little more efficient, say scoring a touchdown 35% of the time, Ogunbowale needs to be an almost perfect 95% for kicking to be preferable. If the Texans are slightly less efficient, say scoring 25% of the time, Ogunbowale only needs to convert at a 75% rate to opt for kicking.
Depending on how the Texans feel about their offensive productivity at the moment, and their best estimation of Ogunbowale’s kicking ability, they could go either way. In the game, they opted to go for it and scored a touchdown (and got the 2 point conversion). Based on the analysis it’s a close call, but you can’t blame them for steering away from Ogunbowale. After all, who’s to say how efficient a running back is kicking from 26 yards.
Less than six in-game minutes later, lightning strikes twice. Now it’s all tied up with 8:45 to go, and the Texans have 4th and goal from the 11. Almost the exact same situation as before. Let’s reevaluate the win probabilities for the Texans given the possible outcomes of kicking or going for it:
| Result | Probability |
|---|---|
| Field goal is missed | 51.6% |
| Field goal is made | 60.3% |
| Touchdown is missed | 55.5% |
| Touchdown is made* | 90.1% |
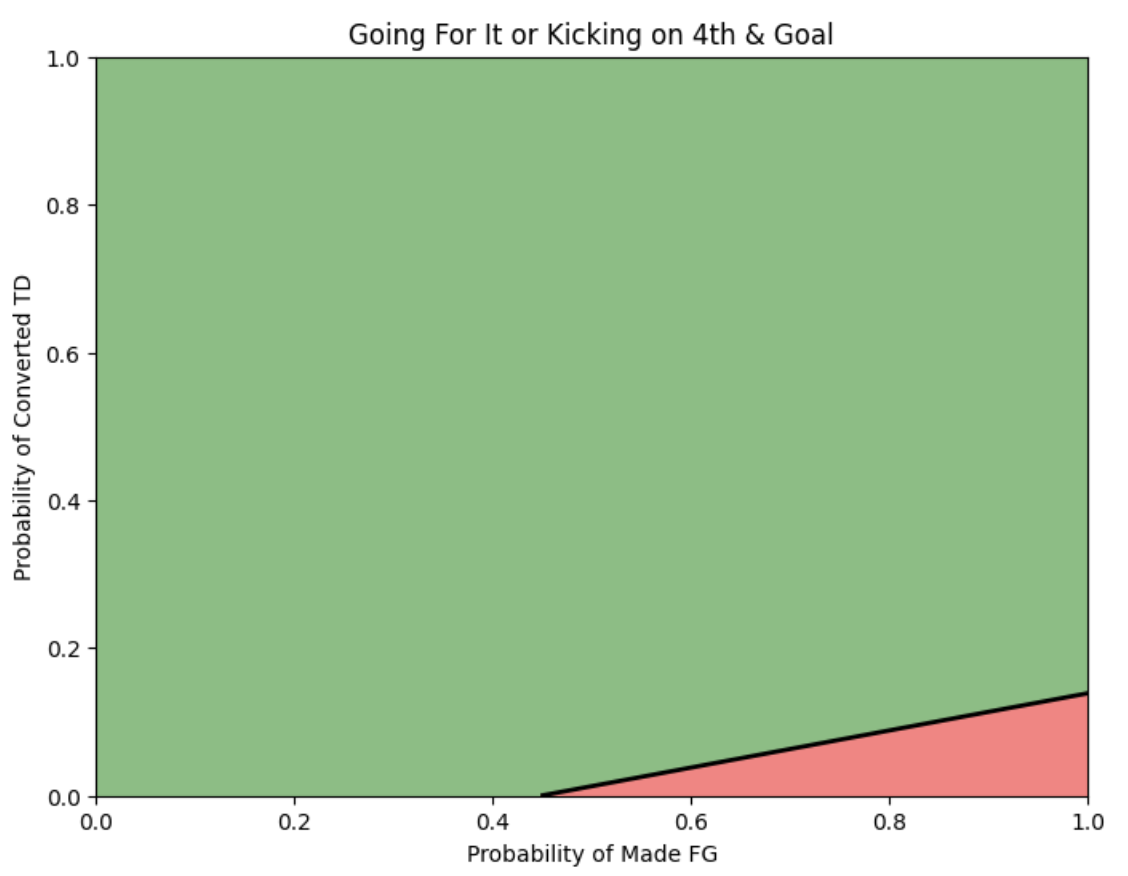
Just looking at probabilities, it’s clear two things have happened compared to last time they had the ball. First, a made field goal is less helpful. Second, a made touchdown is more helpful. So even though the end zone is 2 yards further this time, a touchdown is much more important. One would assume that if the Texans didn’t bring out the running back kicker last time, surely they wouldn’t kick it now. Using the updated inequality plot:

We actually see that even if they are 100% sure Ogunbowale will hit the field goal, as long as they convert the touchdown 14% of the time they should not kick the ball. And if we discount Ogunbowale to a modest, but hopeful, 85% from 28 yards, they only need to score the touchdown 10% of the time to be more efficient going for it. For reference, teams convert on 4th and 11 about 27% of the time. So go for it, right?
They bring out Ogunbowale anyways. He strikes it dead between the posts. The Texans kick off, Baker Mayfield and the Buccaneers get the ball back and drive down to score a touchdown, regaining a 4 point lead with 46 seconds left. At this point the Texans might be wishing they had went for the touchdown after all, as suggested by the calculator. But, in a heroic effort, a 75 yard touchdown drive from Stroud wins the game for the Texans anyways. CJ Stroud and Dare Ogunbowale: 1. Computer and line graphs: 0.
The Calculator 🔗
The Texans game is not a great advertisement for the 4th and Goal calculator. The calculator, as of now, is very cumbersome, but I do intend to improve it. Currently it requires you to go fetch the probabilities (as seen in the tables above) and then plug them in. From there it generates the plots. In a more elegant version the calculator would just require the game situation, and from that calculate the probabilites itself and, resultingly, the plot.
I decided the plots make the most sense because there are two unknowns: the probability of converting the touchdown, and the probability of making the field goal. You could require an estimate of one of these values and output the other, but the plots are easy to read so why limit the range of possibilties. The code is on my Github.
*The “touchdown made” win probability is the average of the probabilities after a touchdown + 2 pt conversion and touchdown + no 2 pt conversion. This lacks something in sophistication but for these two particular situations the outcome does not change all that much.